BMI stands for body mass index, and it measures the relationship between your height and weight. Specifically, it’s calculated dividing your weight by your height in meters squared.
A BMI chart is a visual representation of different BMI ranges that helps you understand whether you should gain, maintain, or lose weight.
BMI charts are one of the best ways to get a quick bird’s-eye view of your body composition and overall health, but you should also rely on several other methods to determine whether or not you should lose weight.
The reason for this is that BMI charts aren’t very useful for predicting the health of most individuals. This is particularly true when it comes to BMI for weightlifters and other muscular people.
Keep reading to learn more about how BMI charts, whether or not men and women should use separate BMI charts, and more.
Table of Contents
+
What Is BMI?
BMI stands for body mass index, which is a numeric expression of the relationship between your height and weight.
To calculate BMI, you divide your weight in kilograms by your height in meters squared.
For example, I weigh 175 pounds and I’m 5’10.
To find my BMI, I’d first divide my body weight in pounds by 2.2 to convert it into kilograms.
175 / 2.2 = 79.55 kilograms
For a calculation like this I’d normally round to the nearest whole number to simplify the math, but small variations in weight or height can lead to large changes in BMI, so it’s best to be as precise as possible.
Next, I multiply my height in inches (70) by 2.54 to convert it into centimeters.
70 x 2.54 = 177.8 centimeters
Which I then convert into meters by moving the decimal point two places to the left:
177.8 centimeters = 1.778 meters
Next, I square my height in meters.
1.778 x 1.778 = 3.16
Finally, I divide 79.55 by 3.16 to arrive at my BMI.
79.55 / 3.16 = 25.2
We’ll round that to 25.
After calculating your BMI, you use your score to determine what weight category you belong to:
- Underweight = BMI of less than 18.5
- Normal weight = BMI of 18.5 to 24.9
- Overweight = BMI of 25 to 29.9
- Obese = BMI of 30 or greater
And you want to skip all of the math, use the Legion BMI Calculator to quickly and easily calculate your BMI.
(As you can see, I’m part of team #overweight. This is misleading, though, for reasons you’ll learn in a moment).
These ranges are sometimes adjusted for different groups of people.
For example, some studies show that Asians have a higher risk of weight-related diseases despite being in the “normal weight” category, so some experts recommend lowering the threshold for what’s considered overweight or obese for Asians.
The History of BMI Charts
The equation for calculating BMI was developed in the early 1800s by a Belgian mathematician named Adolphe Quetelet, one of the first people to statistically analyze variations in human size, proportions, and growth rates.
One of his most enduring accomplishments was creating an accurate formula for estimating body fatness.
Known as the Quetelet index after its creator, this formula later became known as body mass index after the publication of a 1972 paper showing a link between BMI and health problems.
At the time the original Quetelet index was created, body fat was considered unsightly but not necessarily unhealthy.
As our understanding of the body leaped ahead in the 19th century, though, it became obvious that being fat—or corpulent in the parlance of the times—was a direct cause disease and dysfunction.
Scientists needed a simple way to estimate the body fat percentage of large groups of people to confirm their suspicions, and began using BMI as a proxy for body fatness, which is how it’s still used today.
What Is a BMI Chart?
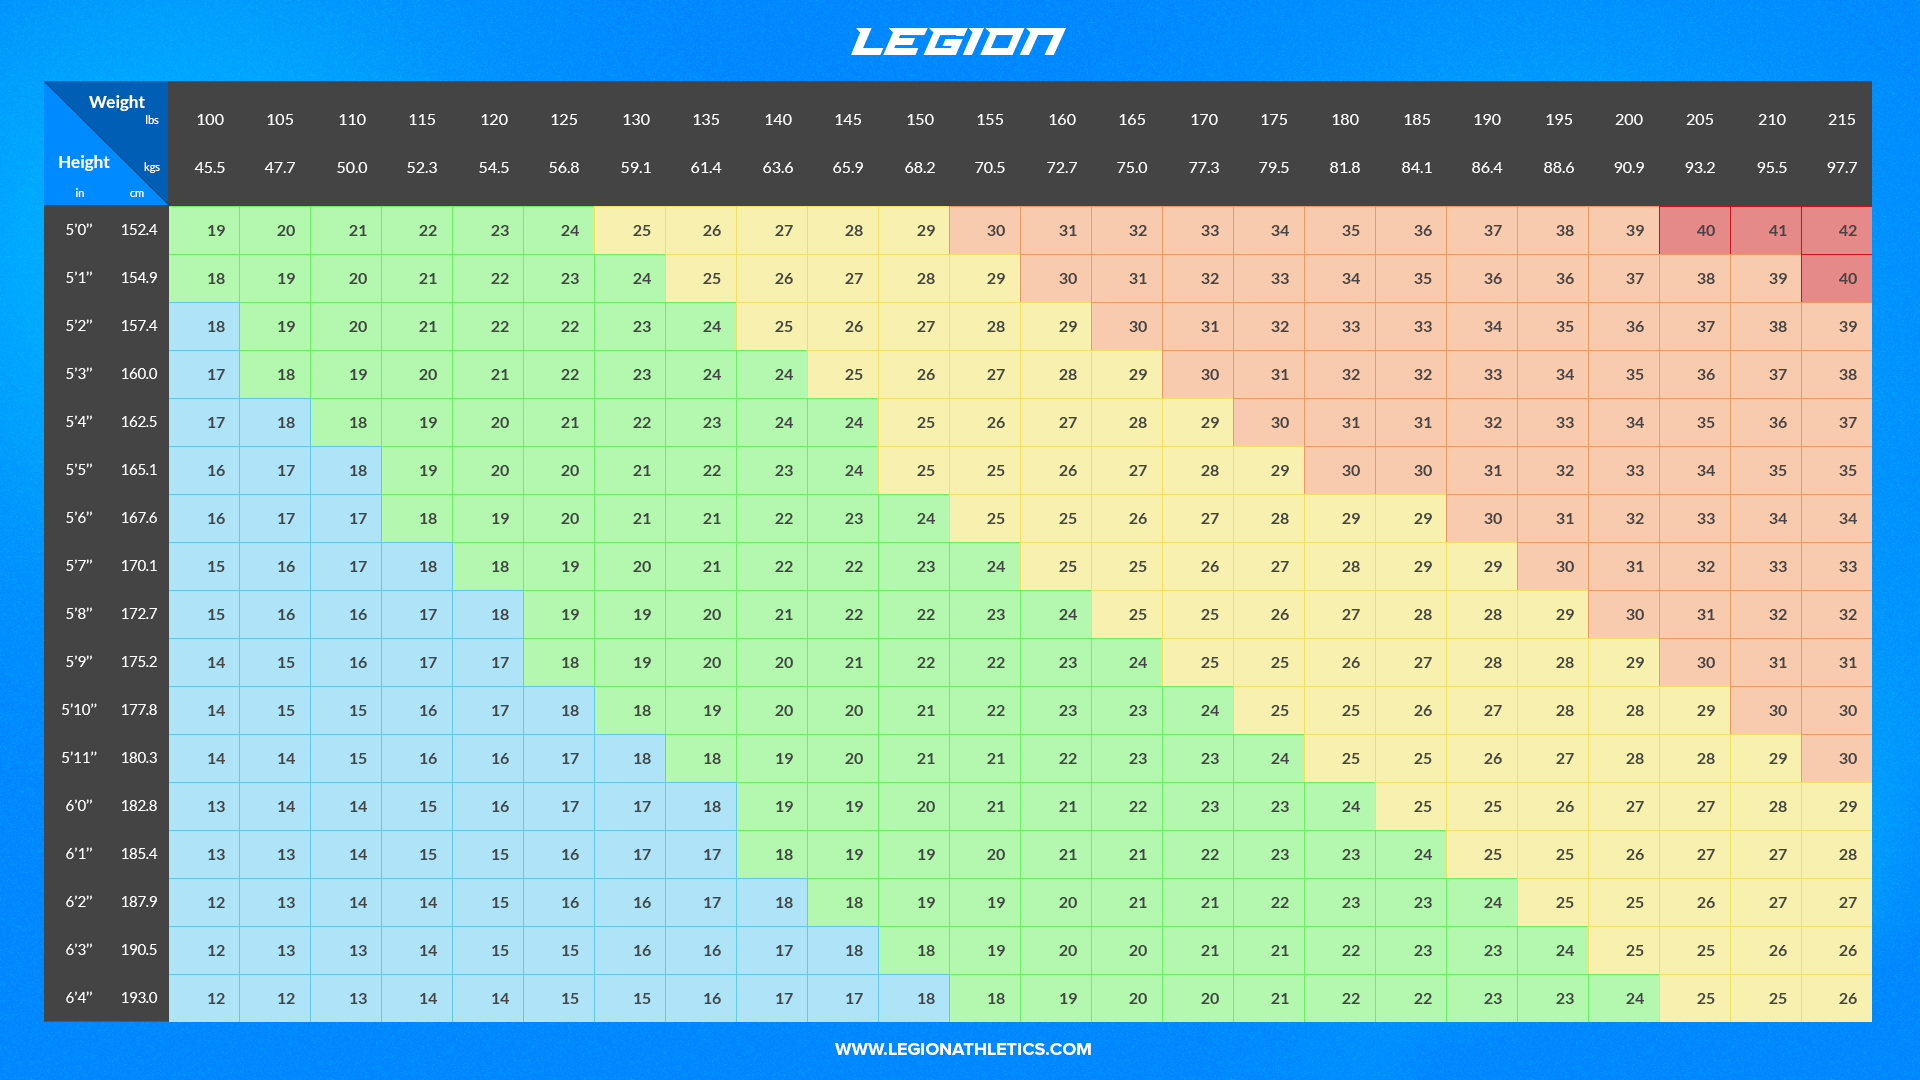
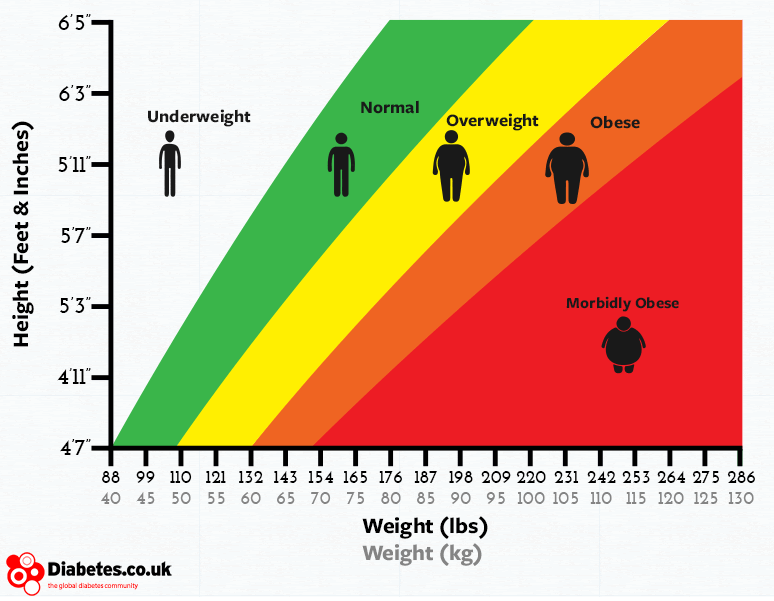
A BMI chart is a table or graphic that helps you find which weight category you belong to based on your BMI.
Here’s what A BMI charts looks like:
And here’s a visual of the same information:
To use a BMI chart, though, you first need to know your BMI.
Based on the calculations we did a moment ago we know my BMI is about 25.
Next, we find my height in the vertical column of the table:
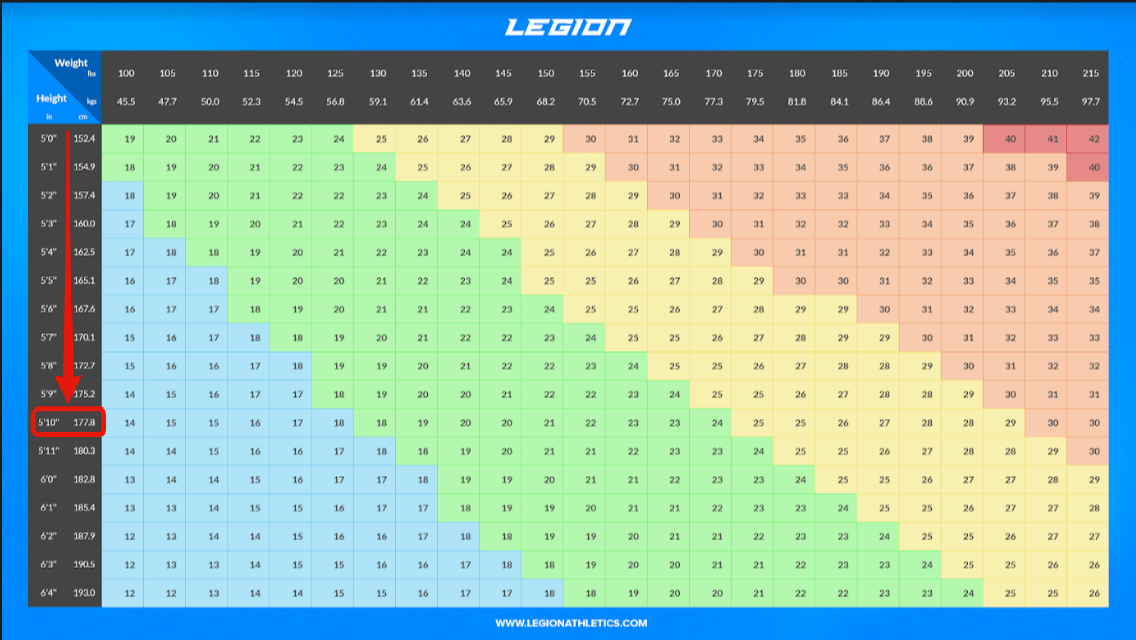
We trace the row to the right until we find my BMI.
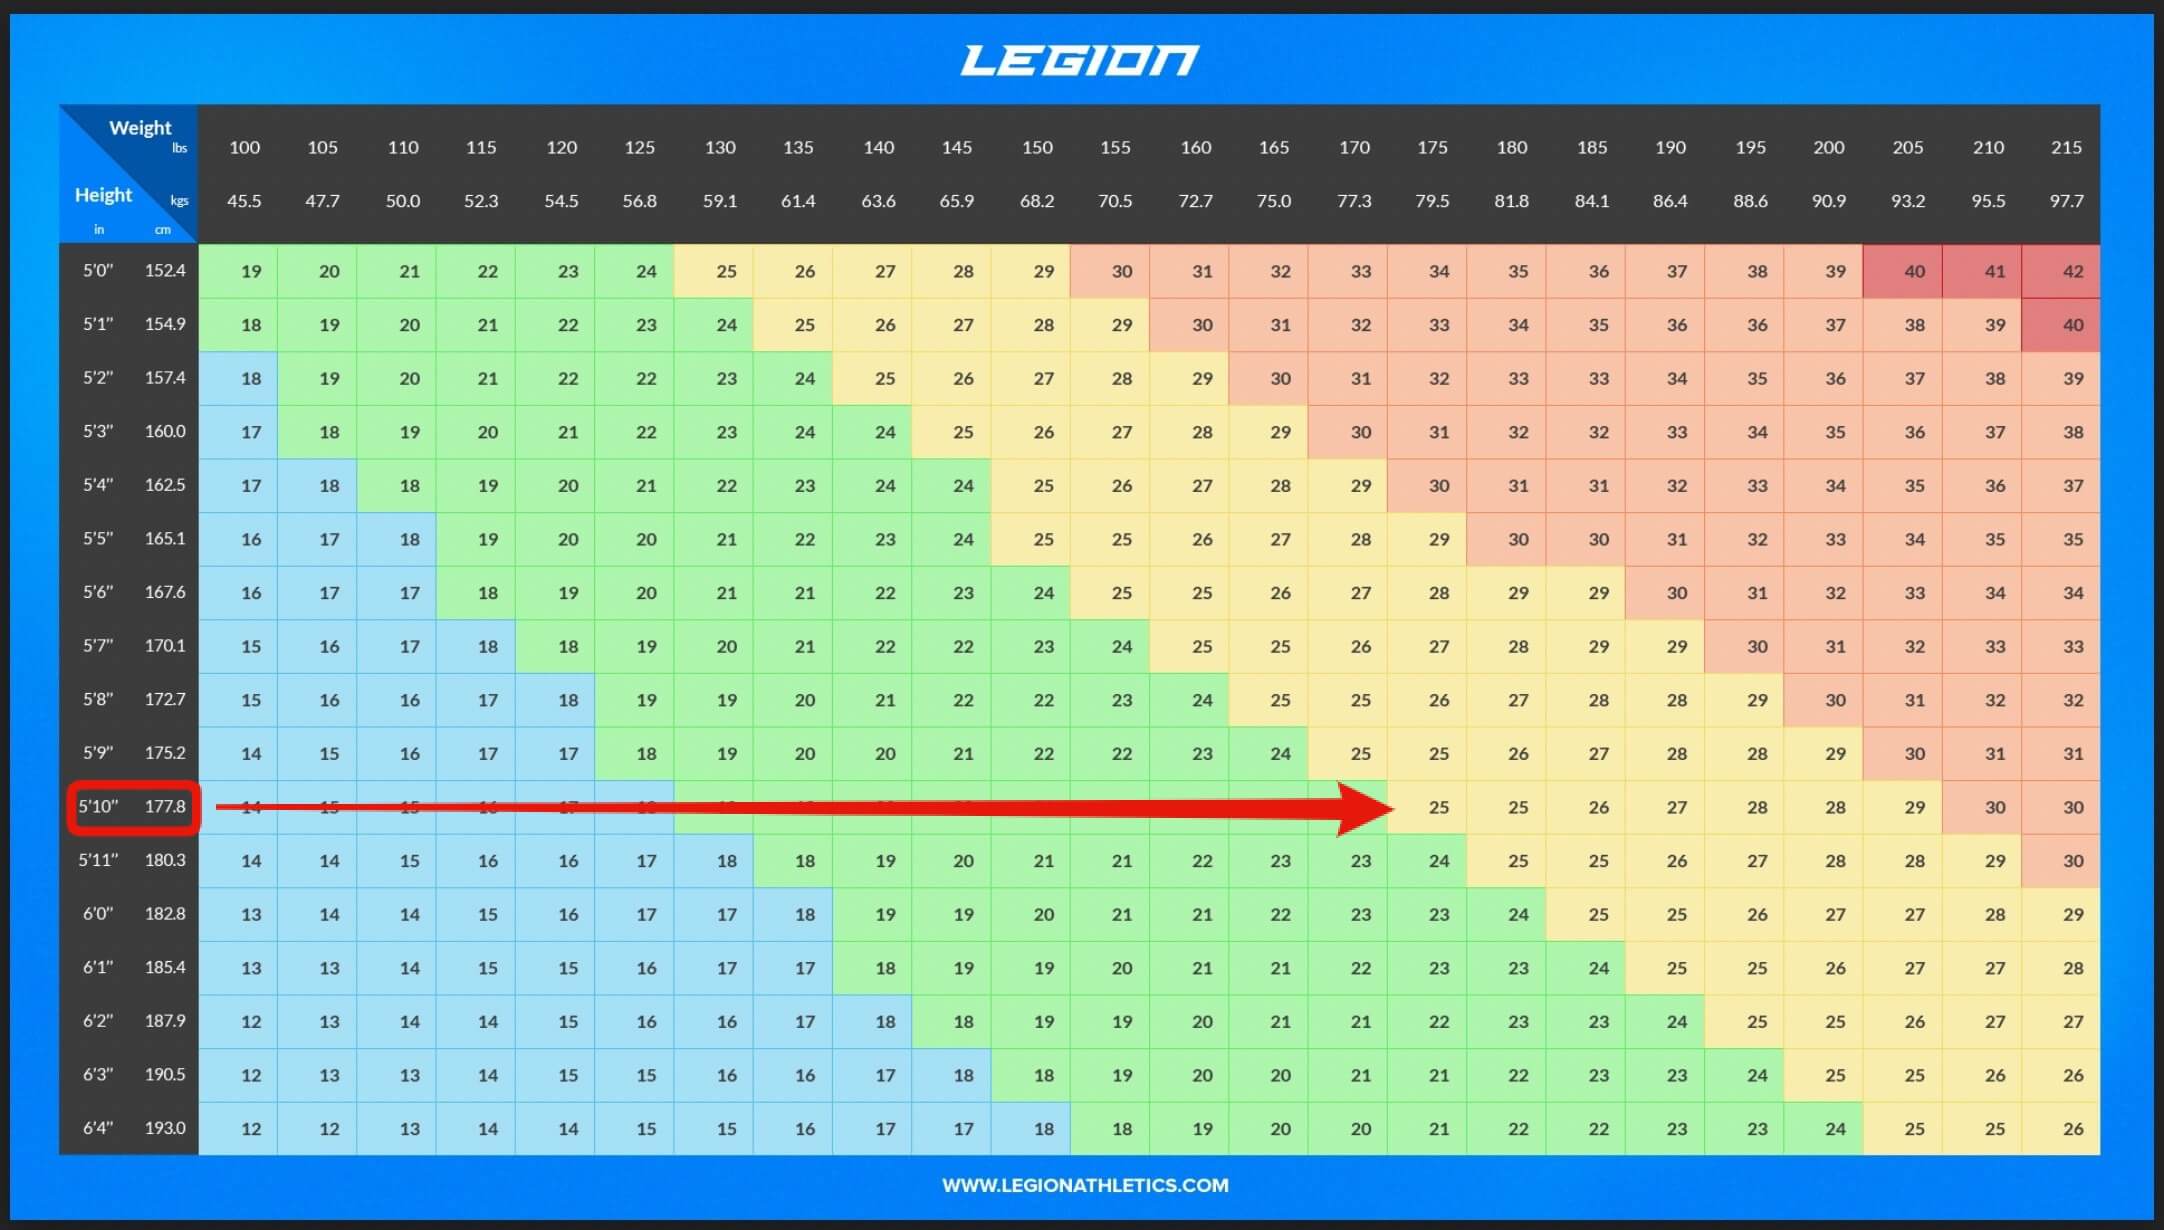
(You can also do all of this with the Legion BMI Calculator).
According to the BMI chart, I’m overweight. This befuddles many fit people and leaves them feeling like our dear friend Mr. Bateman here . . .

But, is this really cause for concern?
I’m about 10% body fat and have a six pack a 32-inch waist—not exactly Michael Moore territory.
Wat? How can I be lean and still be considered “overweight?” Is this proof positive that BMI charts are BS after all?
Not really. Let’s go over why.
Detractors say you can’t distill what it means to be healthy into a single number.
Some go further and say being overweight isn’t unhealthy, so why bother measuring BMI or worrying about your weight?
Others point out that BMI charts don’t work well for muscular people.
Are BMI Charts Accurate?
According to many fitness gurus, Internet doctors, and magazines, the key flaw of BMI charts is that they overestimate the number of people who are overweight.
That is, if you judge people solely based on their BMI, a lot of perfectly healthy people are going to be classified as overweight or obese.
For example, I’m overweight according to BMI charts, so BMI must be fake news, right?
Wrong.
The truth is that the main problem with BMI charts is that they underestimate the number of people who are overweight or obese.
A 2010 meta-analysis conducted by scientists at the Mayo Clinic illustrates this nicely.
The scientists looked at the BMIs of 32,000 people whose body fat percentage was measured with bioelectrical impedance, which isn’t always accurate but works well enough for large groups of people.
The results?
Half of the people who were considered “normal weight” or “overweight” according to BMI were found to be obese based on their actual body fat percentage (25% body fat for men and 35% for women).
In other words, BMI actually paints a rosier picture of people’s health than many realize.
This is probably because these people were “skinny fat.” They had remarkably little muscle mass—which weighs more than fat—and a lot of body fat, which kept their total weight lower than you’d expect based on their level of body fat.
Although BMI wasn’t entirely accurate at determining who was overweight or not, it was very accurate at determining who was obese or not.
The scientists found that 95% of men and 99% of women who were obese according to the BMI chart were, in fact, actually obese according to their measured body fat percentage.
Why?
Because when you gain enough body fat, BMI will predict your body fat percentage well enough to classify you as obese, regardless of how much or little muscle you’re carrying.
Other studies conducted by scientists at New York University, Memorial University of Newfoundland, and the World Health Organization concluded the same thing.
If you’re obese according to a BMI chart, you’re probably obese.
Okay, fine, you might be thinking—usually it’s not hard to tell if someone is obese or not.
But what about the exceptions? What about people like me, who are still considered overweight but obviously aren’t? What about people who are big-boned?
Won’t these people be unfairly labeled as fat and pressured to lose weight?
Are BMI Charts Accurate for Muscular People?
Standard BMI charts are based on the assumption that the people being measured have a relatively normal amount of lean body mass.
In case you aren’t familiar with the term, lean body mass refers to all of the material in your body that isn’t fat, such as water, bone, and muscle.
People who don’t lift weights generally have relatively stable levels of lean mass, and so changes in body weight come from rising or falling body fat levels. If someone in this category is well above the “normal weight” category on BMI charts, then it’s reasonable to assume they’re there because they have a lot of body fat.
The vast majority of people have, by definition, an average amount of muscle mass, which means BMI charts are going to be accurate for them more often than not.
What about people who have more muscle than average but relatively little body fat?
What about people who lift weights and have muscular builds?
Couldn’t they be unfairly classified as “obese” according to BMI charts?
No.
Even the most dedicated, genetically gifted of us can only build enough muscle to nudge us into the “overweight” category, which isn’t an issue as long as you’re still relatively lean (more on that in a moment).
For example, according to the best predictors of my genetic muscle-building potential, the most I’ll ever probably weigh is about 185 pounds at 10% body fat. To get there I’ll need to gain another ~10 pounds of muscle.
That would peg my BMI at about 27 still, which is right in the middle of the “overweight” category and a long way from the “obese” category.
To be considered “obese,” I’d have to gain 30 pounds of muscle.
That simply isn’t possible for me to accomplish without taking steroids.
Here are some more examples of people close to their genetic limit for muscle growth:
A woman who’s 5’4, 150 pounds, and 20% body fat would have a BMI of 25.7, which is in the middle of the “overweight” category.
A man who’s 6’, 190 pounds, and 10% body fat would have a BMI of 25.8, again, in the middle of the “overweight” category.
This brings us to another specious argument that “BMI-deniers” like to harp on. They’ll often say things like, “Just look at your favorite athletes! Many of them are in the peak of health but are considered obese according to BMI alone!”
Well, sure, but pretending that professional athletes aren’t using some extra #dedication to reach those freakish weights is asinine.
So, what to make of all this?
Lifting weights can give you enough additional muscle mass to be considered overweight according to BMI charts, but you can’t gain enough muscle to be considered obese without using steroids.
Thus, if you lift weights and have a muscular build, you shouldn’t be worried if you’re “overweight” according to a BMI chart.
Are BMI Charts Accurate for “Big-Boned” People?
Bone mineral density, or simply bone density, is a measurement of the strength and weight of your skeleton.
We’ve known for a long time that bone density can change due to your genetics, strength training, and activity levels.
Many point to this as another failing of BMI charts. Some people have such dense bones, they claim, that they could end up in the “overweight” or “obese” category.
This is also wrong.
You can see why with simple math.
Depending on who you ask, your skeleton weighs around 15% of your total body weight.
Around ~30% of the weight of bone is water, 20% is protein (mostly collagen), and around 50% is minerals and traces of other compounds.
Once you run the numbers using these figures, you’ll quickly realize that bone mineral density has a negligible impact on your body weight and BMI.
I’ll use myself as an example again.
I weigh 175 pounds, so we can assume my skeleton weighs around 26 pounds.
175 x 15% = ~26 pounds
We can subtract 50% from those 28 pounds to estimate the mineral weight of my bones.
26 x 50% = 13 pounds
Let’s say I increased my bone mineral density by a few percentage points, which is the upper end of what you can expect from a good strength training program.
I could theoretically increase the weight of my skeleton by less than a pound—not enough to make a lick of difference on a BMI chart.
There also isn’t much variability in the weight of people’s skeletons, so it’s unlikely one person was born with bones that were heavy enough to make them overweight on a BMI chart.
At bottom, some people do have heavier bones than others thanks to genetics and training, but the differences are too small to have a significant effect on your BMI.
Are BMI Charts Accurate for Women?
Yes.
Although women carry more essential body fat than men, it’s not a big enough difference to invalidate BMI charts.
Thus, the BMI formula for men and women is identical.
Why BMI Charts Aren’t Bogus
A common criticism of BMI is that because it’s been around so long—the mid 1800s—it’s “outgrown its utility” and no longer represents a valid way to know if you’re at a healthy weight.
Like the iron lung for polio, heroin for the common cold, and lobotomies for seizures, BMI is just another outdated medical practice that should be thrown on the scrap heap of history, they say.
Last time I checked, though, bodily proportions and the fundamental rules of math haven’t changed much in 200 years, and the scientific evidence shows they certainly haven’t.
In the final analysis, the chances are slim to nil that you’ll find yourself in the “obese” category without also carrying a lot of body fat or using steroids.
And chances are also good that unless you lift weights or have very good genetics for muscle growth, if you’re in the “overweight” category on a BMI chart, you could also stand to lose some weight.
The home truth is that the reason so many people like to rail against BMI is because it’s often a number they don’t like.
Instead of telling people the truth—that being overweight or obese is bad for you, and BMI is good at predicting who falls into these two categories—they point to the shortcomings of BMI as evidence that it doesn’t matter.
If you’re obese according to BMI charts, there’s a 95% chance you’re actually obese if you’re a man and a 99% chance you’re obese if you’re a woman. If you’re overweight according to a BMI chart, then you’re also probably overweight and could benefit from losing weight (unless you lift weights or have a naturally muscular build).
A Better Way to Know if You’re at a Healthy Weight
BMI is based on your height and weight, and your height isn’t going to change.
So, in effect, tracking your BMI is no different than tracking your body weight.
Tracking your weight is helpful, but that doesn’t tell you whether you’re gaining or losing muscle or fat, which is what you should pay attention to if you want to improve your health, appearance, and vitality.
In other words, it’s better to track your body composition than your weight or BMI, which is what you really want to improve.
Body composition refers to how your body breaks down in terms of fat, muscle, water, bone, etc, and is a much more helpful metric for tracking your progress.
There are a few different methods and models for calculating body composition, but we’ll stick with a simple one for the purposes of this article—one that separates your body into two categories:
- Fat mass, which is all of the fat in your body.
- Fat-free mass (often referred to as FFM or lean body mass), which is everything in your body that isn’t fat, including muscle, bone, blood, organs, water, glycogen, and more.
By monitoring these things—as opposed to BMI or just body weight—we can better understand our health and how quickly we’re moving toward our physique goals.
Estimating your body fat percentage isn’t hard, but since every method has its pros and cons, your best bet is to use several different techniques to get a more accurate reading.
The best ones are:
- Body fat calipers
- Waist circumference
- Progress pictures and the mirror
- How your clothes fit
If you’d like to learn how to estimate and track your body fat percentage, check out the Legion Body Fat Percentage Calculator.
The Best Supplements for Improving Body Composition
You don’t need supplements to lose fat or build muscle—but the right ones can make both easier, faster, and more enjoyable.
Here are some of the best options to consider:
Supplements for Fat Loss
- Caffeine: 3-to-6 mg of caffeine per kilogram of body weight per day increases metabolic rate and helps you train harder while dieting. For a clean, delicious source of caffeine, try Pulse.
- Yohimbine: 0.1-to-0.2 milligrams of yohimbine per kilogram of body weight before fasted training increases fat loss and is particularly helpful with losing “stubborn” fat. For a natural source of yohimbine, try Forge.
- Fat Burner: Effective fat burners contain ingredients that boost the number of calories you burn and reduce hunger and cravings, making weight loss more straightforward. For a top-tier fat burner, try Phoenix.
(If you’d like even more specific advice about which supplements you should take to reach your health and fitness goals, take the Legion Supplement Finder Quiz, and in less than a minute, you’ll know exactly what supplements are right for you.)
Supplements for Building Muscle
- Protein powder: Protein powder, such as Whey+ (Legion’s whey isolate) or Casein+ (Legion’s micellar casein), provides your body with the nutrients needed to build muscle tissue and recover from workouts.
- Creatine: Creatine boosts muscle and strength gain, improves anaerobic endurance, and reduces muscle damage and soreness from your workouts. For a natural source of creatine, try Legion’s creatine monohydrate, creatine gummies, or post-workout Recharge.
- Pre-workout: A high-quality pre-workout enhances energy, mood, and focus, increases strength and endurance, and reduces fatigue. For a top-tier pre-workout containing clinically effective doses of 6 science-backed ingredients, try Legion’s Pulse with caffeine or without.
Scientific References +
- Romero-Corral, A., Somers, V. K., Sierra-Johnson, J., Thomas, R. J., Collazo-Clavell, M. L., Korinek, J., Allison, T. G., Batsis, J. A., Sert-Kuniyoshi, F. H., & Lopez-Jimenez, F. (2008). Accuracy of body mass index in diagnosing obesity in the adult general population. International Journal of Obesity, 32(6), 959–966. https://doi.org/10.1038/ijo.2008.11
- Fogelholm, M. (2010). Physical activity, fitness and fatness: Relations to mortality, morbidity and disease risk factors. A systematic review. In Obesity Reviews (Vol. 11, Issue 3, pp. 202–221). Obes Rev. https://doi.org/10.1111/j.1467-789X.2009.00653.x
- Layne, J. E., & Nelson, M. E. (1999). The effects of progressive resistance training on bone density: A review. Medicine and Science in Sports and Exercise, 31(1), 25–30. https://doi.org/10.1097/00005768-199901000-00006
- Percent of skeleton out of total body weight - Human Homo sapiens - BNID 107236. (n.d.). Retrieved April 30, 2021, from https://bionumbers.hms.harvard.edu/bionumber.aspx?id=107236
- Kelley, G. A., Kelley, K. S., & Kohrt, W. M. (2013). Exercise and bone mineral density in premenopausal women: A meta-analysis of randomized controlled trials. In International Journal of Endocrinology (Vol. 2013). Int J Endocrinol. https://doi.org/10.1155/2013/741639
- Arden, N. K., & Spector, T. D. (1997). Genetic influences on muscle strength, lean body mass, and bone mineral density: A twin study. Journal of Bone and Mineral Research, 12(12), 2076–2081. https://doi.org/10.1359/jbmr.1997.12.12.2076
- Arvin Raj Goonasegaran, Fatin Nabila Nabila, & Nurul Shuhada Shuhada. (n.d.). Comparison of the effectiveness of body mass index and body fat percentage in defining body composition - PubMed. Retrieved April 30, 2021, from https://pubmed.ncbi.nlm.nih.gov/22711041/
- Physical status: the use and interpretation of anthropometry. Report of a WHO Expert Committee - PubMed. (n.d.). Retrieved April 30, 2021, from https://pubmed.ncbi.nlm.nih.gov/8594834/
- Kennedy, A. P., Shea, J. L., & Sun, G. (2009). Comparison of the classification of obesity by BMI vs. dual-energy X-ray absorptiometry in the newfoundland population. Obesity, 17(11), 2094–2099. https://doi.org/10.1038/oby.2009.101
- Shah, N. R., & Braverman, E. R. (2012). Measuring adiposity in patients: The utility of body mass index (BMI), percent body fat, and leptin. PLoS ONE, 7(4). https://doi.org/10.1371/journal.pone.0033308
- Keys, A., Fidanza, F., Karvonen, M. J., Kimura, N., & Taylor, H. L. (1972). Indices of relative weight and obesity. Journal of Chronic Diseases, 25(6–7), 329–343. https://doi.org/10.1016/0021-9681(72)90027-6
- Misra, A., & Khurana, L. (2009). The metabolic syndrome in South Asians: Epidemiology, determinants, and prevention. In Metabolic Syndrome and Related Disorders (Vol. 7, Issue 6, pp. 497–514). Metab Syndr Relat Disord. https://doi.org/10.1089/met.2009.0024
- Misra, A., & Bhardwaj, S. (2014). Obesity and the metabolic syndrome in developing countries: Focus on South Asians. Nestle Nutrition Institute Workshop Series, 78, 133–140. https://doi.org/10.1159/000354952


